Image Sharpness vs Aperture
Graphs are wonderful things. With a mere glance we can read a huge amount of information. This makes graphs very much preferable to the tedious multitude of words and numbers that would be needed to describe the exact same thing. So, we’ll use a few graphs to describe what happens to image sharpness as we alter aperture. And, to make things even easier, we’ll take a concrete example and use that to illustrate general principles.
Here we go: We are using a 35 mm lens. We focus at 3 m. We set aperture to f/4.
We know (or think that we know) that objects 3 m away will appear perfectly sharp in our image. We expect objects beyond or in front of the focus distance to appear sharp if they are close to the focus distances but to appear blurry if they are far from the focus distance.
Let’s show how blurry objects will appear at various distances. Here’s a nice, simple graph. It shows image blur size against distance. (Note: 1 micron = 0.001 mm. Note also that the results presented on these graphs are independent of camera format, so the results will be the same no matter what camera you have.)
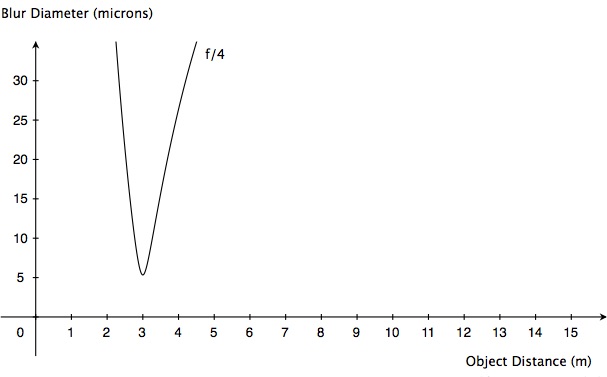
As expected, blur is at a minimum (and thus image sharpness is at a maximum) at our chosen focus distance of 3 m. On either side of that distance, blur rapidly rises. If you focus a 35 mm lens on 3 m, and shoot at f/4, you will have very little depth of field—only object very close to the focus distance will appear sharp.
At 3 m, the blur diameter is close to zero. Why not exactly zero? Well, there’s diffraction at work. Diffraction is always with us, even at f/4. It’s a small effect—a mere 5 microns of blur. Too small to worry about in this case. No commercially available sensor that I know of can resolve image detail as small as a 5 micron blur so, as far as any sensor is concerned, it makes no difference if a lens casts a 5 micron blur on it in place of a perfectly sharp image.
Another way to illustrate how insignificant diffraction is at f/4 is to plot the curve showing what blur would be like in the absence of diffraction, as is done in classical depth of field theory (which pretends that diffraction does not exist). Notice how closely that curve matches the real-world blur curve?
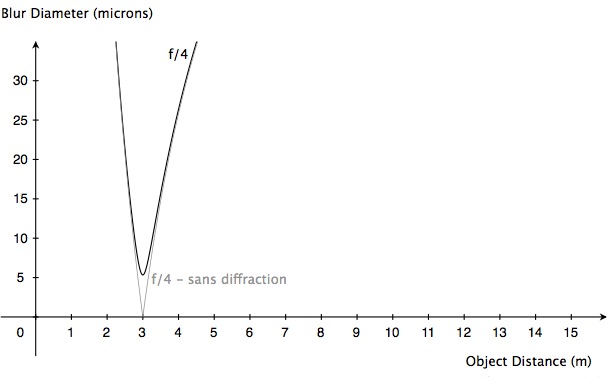
See, it’s perfectly OK to ignore diffraction, at least at f/4.
Of course, the match between real-world blur curves and imaginary no-diffraction curves is even better at smaller f-numbers. But what happens at larger f-numbers? We know that diffraction increases as f-number is made larger, so we expect things to get interesting. Let’s have a look now at a series of graphs showing image blur at different apertures.

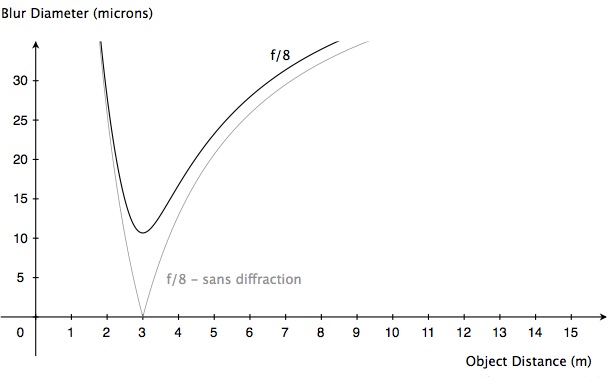
At f/5.6, we can more or less comfortably go on pretending that there is no such thing as diffraction. But things start looking quite different by the time we get to f/8. There are cameras on the market which can capture detail as small as 10 microns or so. If you have such a camera, you’re beginning to record blur even for objects at the focus distance. And by f/11, you had better start thinking about how realistic classical depth of field theory is and ask yourself if it really is a good idea to base your depth of field calculations on that “sans diffraction” curve.
Speaking of depth of field, let’s look at it a bit more closely.
When we talk of depth of field, we talk of the region in which objects appear sharp, i.e. where image blur is so small that it is not noticeable. But how small does a blur have to be before it ceases to be noticeable? Is it 30 microns? 20 microns? 10? These numbers refer to blur sizes on the sensor. But we do not ever look at that tiny image that the lens projects onto the sensor — we look at a reproduction of that image, blown up to a convenient size on a computer screen or as a print. The more you blow up an image, the more noticeable blur becomes. A 30 micron blur on the sensor may be small enough not to show up as a blur if we print the image on our inkjet printer on 10 x 15 cm (4 x 6 in) paper, but certainly will be noticeable as a blur if we print the image at poster size.
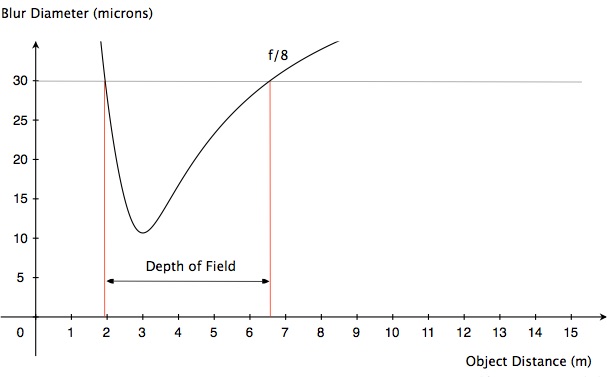
For the sake of argument, let us say that 30 microns is the largest blur diameter that we are willing to accept on our sensor. (Why did I pick 30 microns? No particular reason… although it does happen to be roughly the number used by lens manufacturers in constructing depth of field scales for lenses for 35 mm cameras.) In that case, we see on the following graph, for the lens shot at f/8, that objects from just under 2 m to about 6.5 m will appear sufficiently sharp. So that’s our depth of field.
Had we performed the same analysis using the classical depth of field (sans diffraction) curve, we would have calculated a greater depth of field. Alas, that result would not correspond to reality. So we shall henceforth dispense with those curves.
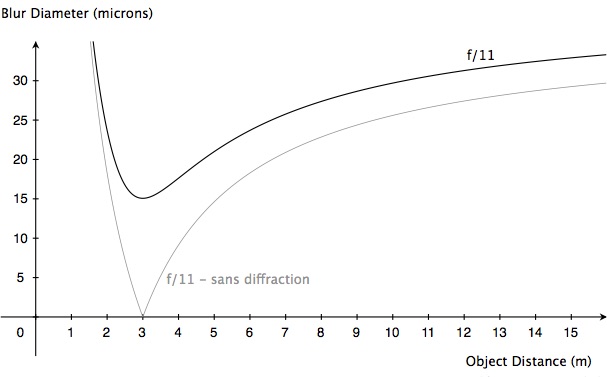
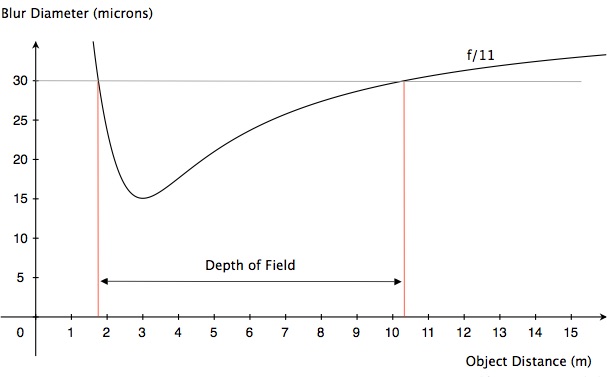
Want more depth of field? Try are larger f-number. Here’s the curve for f/11:

All very nice. We’re not concerned that the image is becoming more blurry at the focus distance because, at 15 microns, that blur is way smaller than our specified sharpness criterion of 30 microns.
Want even more depth of field? We’ll stop down even further, won’t we? Here is a series of graphs showing what happens at 1/2-stop intervals as we stop down further:
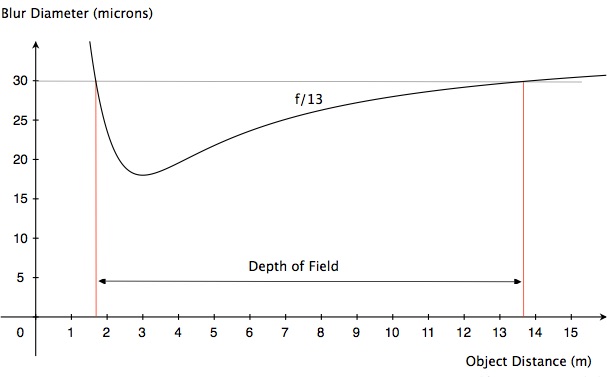
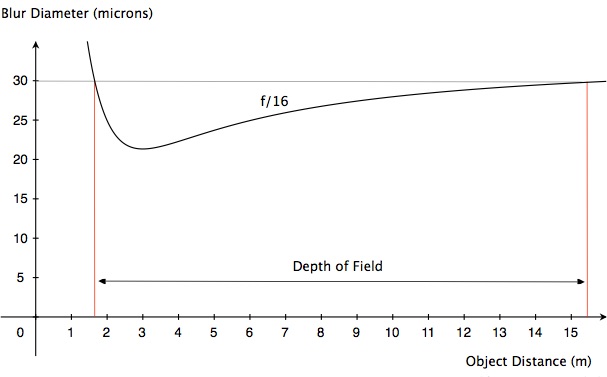
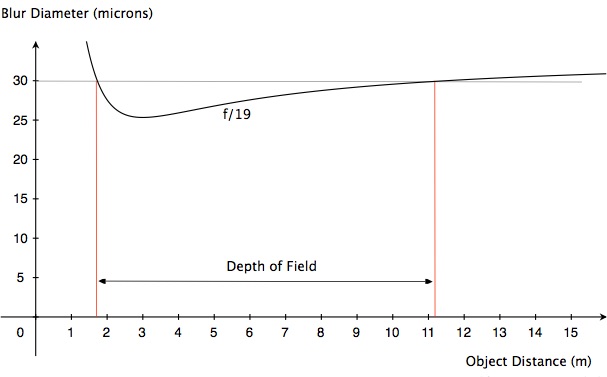
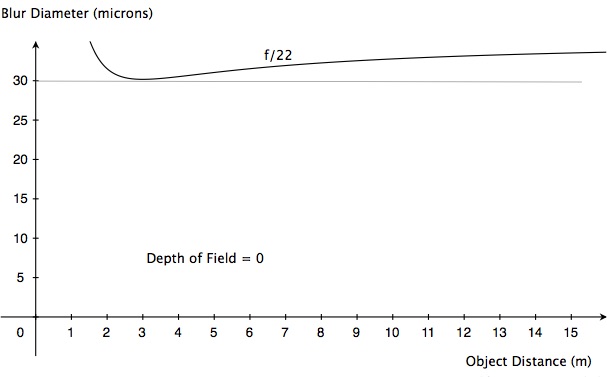
Well, this is certainly interesting. Up to about f/16, stopping down does indeed result in greater depth of field. But at f/16, depth of field is not much greater than it was at f/13. And then, by f/19, there is so much diffraction that depth of field actually begins to decrease! At f/22, no part of our image, not even for objects at the focus distance, is sharp enough—we have, in effect, zero depth of field.
This effect—depth of field actually decreasing when you exceed a certain f-number—is easily seen when using my TrueDoF-Pro depth of field calculator and is, indeed, one of the key features of that unique app.
Now, I know, the traditional way of doing things is to see depth of field as one thing, and diffraction as another. In traditional depth of field talk, it is assumed that there is no diffraction and that stopping down will always result in greater depth of field, no matter how large the f-number. Diffraction is seen as something separate — something that adds its own effects to every part of the image and become increasingly troublesome at large f-numbers. There is, of course, absolutely nothing that is technically incorrect with that approach. The problem with it is that it is difficult to use: You treat depth of field as a geometrical construct that ignores diffraction, but have to tell yourself that you can’t trust that construct when the f-number gets too large because, really, you shouldn’t be ignoring diffraction. But at what f-number do you suspend trust? And by how much do you compensate for that lack of trust? How sharp will your image actually be? No, it’s not easy. Is it not better to do the calculations properly in the first place?
What I have presented here and in my apps is, in essence, a redefinition of depth of field. By this definition, the region of acceptable sharpness is determined by the combined effects of defocus and diffraction. This is not only more realistic, but also much easier to use. What’s not to like?
It’s particularly important to do the calculations properly now that sensors with high resolving power are increasingly coming on the market. When using a high quality sensor, and when intending to view your images at large sizes, you’d be crazy to stick to a sharpness criterion as large as 30 microns. Remember the curve for the shot at f/11? Here it is again, and again we show the depth of field if we are happy to accept blurs in our image as large as 30 microns. Immediately below that graph is another one showing what depth of field we would have at f/11 if we want no blurs larger than 25 microns.
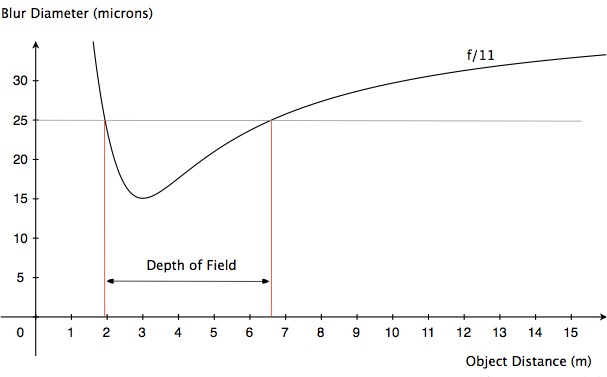
We haven’t changed focal length, or aperture, or focus distance, but we have less depth of field simply because we are being stricter in terms of how much blur we are willing to accept. You can imagine what would happen if we became even stricter and specified 20 microns as our limit—we would have even less depth of field. And if we had a camera that could capture detail down to 10 microns, and we wanted to use the full potential of our sensor? Well, we wouldn’t shoot at f/11, that’s for sure. As the graph shows, at f/11 no part of the image is anywhere near sharp enough by that 10 micron criterion. In effect, we would have no depth of field. And that would not be obvious to you if you stuck to classical “sans diffraction” depth of field theory. So much better to use TrueDoF-Pro instead.
And Finally: Going After Insane Depth of Field
OK, we’ve just seen that depth of field is not very deep when we demand small blur sizes in our images. We can have lots of depth of field, or we can have small blurs, but we can’t have both. But we humans are stubborn creatures. What we’ll do now is demand lots of depth of field AND small blur sizes.
Consider this example. We’ve still got our 35 mm lens. And we’ve going to use it to shoot a scene that extends from 1.5 m to infinity. How sharp can that image possibly be? There is only one way to easily find out: Use the OptimumCS-Pro app. Enter the focal length and the near and far distance extremes. The app then tells us that, for the sharpest possible shot, we need to focus at 3 m and shoot at just over f/16. It also tells us what the size of the largest blur in the image will be. The largest blurs are always those of objects at the distance extremes, and in this case those blurs will be 33 microns in diameter. We can see that our image is not going to be sharp, especially if we have our heart set on, say, 20 microns as the absolute maximum blur. Scroll up and have a look at the curve for f/16—it lies entirely above 20 microns.
There is a reason the above-mentioned app is called “Optimum Camera Settings” — it gives you the settings for the sharpest possible shot (if you’re not familiar with how this app differs from a depth of field calculator, and why it is often much better, check out the article Best Practice in Working with Depth of Field). There is no way we can dispute these results. And since we can’t break the laws of physics, we can’t use a 35 mm lens and get a sharp shot of everything between 1.5 m and infinity.
But remember what I said about being stubborn? There is a way around this. We’ll take not one shot of that scene, but three! We will shoot at f/10, and we’ll focus these shots at 1.8 m, 3.0 m and 9.1 m. No individual shot has sufficient depth of field to cover the entire distance range, but behold the graph:

We load these three shots into focus stacking software which automatically extracts the sharp bits and combines them into a single image. We now have our desired image—sharp from 1.5 to infinity!
For excellent focus stacking software, try Zerene Stacker. For the only way to determine what shots you need to take (aperture and focus distances) in order to get the the results you’re after, you’ll need the unique FocusStacker app. For more information on focus stacking, see the article Focus Stacking in Landscape and Architectural Photography.
© 2013 George Douvos
.